A very important topic for any sales product is the quality control. In many cases products are falsified in regard to the product declaration due to an economic advantage. The use of industrial silicone oil in breast implants, the blending of heparin with oversulfated chondroitin sulfate, and the blending of olive oil with hazel nut oil are a few examples for such falsifications. As you see this is a topic which affects several fields like medicine and pharmaceutical products as well as food products.
The probably most consumed beverage is coffee. As with the mentioned examples the falsification is an important question also for coffee. You read almost everywhere “100 % Arabica” indicating a specific quality of coffee. But how do you know that this is true? To increase the economic profit Arabica coffee is often blended with the cheaper Robusta species. So here as well you need a quality control and a test method that is able to distinguish between Arabica and Robusta.
The NMR spectroscopy can be an option for this quality control. In the 1H-NMR spectrum of the lipophilic coffee extract specific marker are found for Arabica as well as for Robusta coffee. A signal of 16-O-Methylcafestol (16-OMC) is observed in all Robusta samples but not in Arabica. The other way round signals of kahweol are characteristic for samples of Arabica coffee, whereas Robusta coffee showed none or only traces of these signals.
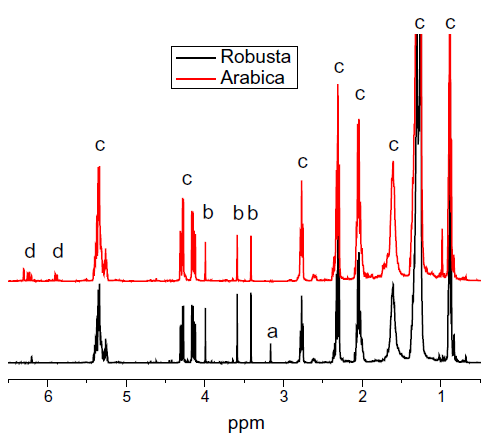
Fig. 1. 1H NMR spectrum of typical Robusta and Arabica coffees (roasted coffee, lipophilic extracts). The following signals are marked: 16-OMC (a), caffeine (b), triglycerides (c), kahweol (d).
So due to the 16-OMC signal we can determine if Arabica coffee is blended with Robusta. However, the contents of diterpenes in coffee show a considerable variability so that the absolute content of 16-OMC cannot give us information of the actual composition of a blended sample and it is not possible to calculate a precise limit of detection. Therefore, the approximate limit of detection for Robusta in Arabica coffee was determined by analyzing experimental blends. Finally we can calculate the LOD to approx. 2-3 % of Robusta.
In a second approach the multivariate analysis of the spectra was performed. Within this evaluation the whole spectrum of the sample is compared with many spectra of Arabica and Robusta. The advantage of this analysis is the fact that not only 16-OMC is used as marker for Robusta coffee but all differences in the spectra. The analysis showed a clear separation of the samples into two groups. Since the evaluation can be performed using the same measurement than for the univariate analysis, it is a meaningful addition.
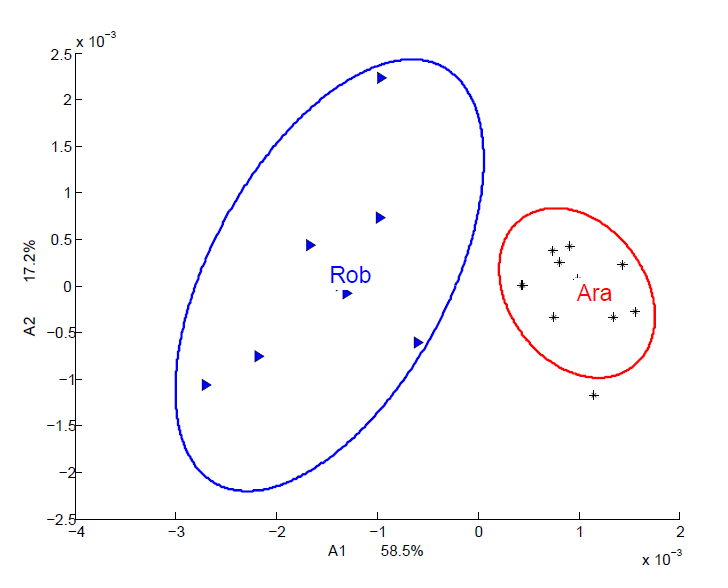
Fig. 2. PCA scores plot for 1H NMR spectra of lipophilic extracts of green coffee (ellipsoids show 95% confidence interval, without exclusion of 16-OMC signals, mean-centering).
Finally, we can say that NMR spectroscopy is the right choice to check your coffee samples on its purity. The measurement takes 20 minutes and it can give you the information if a further time-consuming reference analysis has to be performed for a particular sample.
The research was performed by Spectral Service AG and fully adopted by Steelyard Analytics Inc.
Recent Comments